Bayside Council area
Overseas born - Number of bedrooms per dwelling
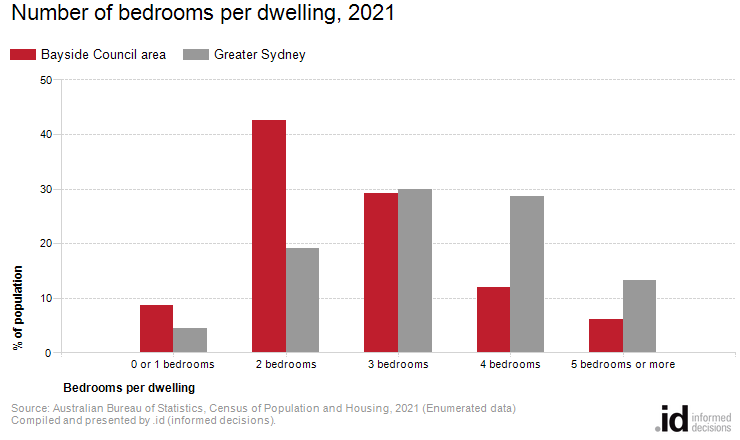
In 2021, people [Toggles].[COIIDDisplayLabel] were most commonly found in dwellings with 2 bedrooms in Bayside Council area.
The Number of Bedrooms in a dwelling is an indicator of the size of dwellings, and when combined with Dwelling Type information, provides insight into the role Bayside Council area plays in the housing market for overseas-born populations.
For example, where migrant populations are mainly students, one bedroom and bedsitters may be dominant. Upgrader areas housing families could have larger separate dwellings, while smaller units may be common for downsizers among older migrant communities.
To the extent that there may be a mismatch between bedrooms and Household size, this topic can also look at the potential for overcrowding in particular communities, or the availability of extra bedrooms.
Derived from the Census question:
'How many bedrooms are there in this dwelling?'
People [Toggles].[COIIDDisplayLabel], counted in private dwellings
| Number of bedrooms per dwelling | ||||||||
|---|---|---|---|---|---|---|---|---|
| Bayside Council area - [Toggles].[COIIDDisplayLabel] | 2021 | 2016 | Change | |||||
| Number of bedrooms | Number | % | Greater Sydney | Number | % | Greater Sydney | 2016 to 2021 | |
| 0 or 1 bedrooms | 7,249 | 8.7 | 4.5 | 4,573 | 6.4 | 4.2 | +2,676 | 21001 |
| 2 bedrooms | 35,401 | 42.6 | 19.2 | 29,814 | 42.0 | 18.6 | +5,587 | 21003 |
| 3 bedrooms | 24,210 | 29.2 | 29.8 | 21,683 | 30.6 | 32.6 | +2,527 | 21004 |
| 4 bedrooms | 9,994 | 12.0 | 28.7 | 8,666 | 12.2 | 27.5 | +1,328 | 21005 |
| 5 bedrooms or more | 5,134 | 6.2 | 13.3 | 4,411 | 6.2 | 11.1 | +723 | 21006 |
| Not stated | 1,041 | 1.3 | 4.5 | 1,778 | 2.5 | 6.0 | -737 | 21007 |
| Total people counted in private dwellings | 83,029 | 100.0 | 100.0 | 70,925 | 100.0 | 100.0 | +12,104 | |
Source: Australian Bureau of Statistics, Census of Population and Housing (opens a new window) 2016 and 2021. Compiled and presented by .id (opens a new window)(informed decisions).
Compiled and presented by .id (informed decisions).
Compiled and presented by .id (informed decisions).
Dominant groups
Analysis of the number of bedrooms in dwellings for people [Toggles].[COIIDDisplayLabel] in Bayside Council area in 2021 compared to Greater Sydney, shows that there was a higher proportion of people [Toggles].[COIIDDisplayLabel] in dwellings with 1 and 2 bedrooms, and a lower proportion in dwellings with 4 or more bedrooms.
Overall, 51.4% of people [Toggles].[COIIDDisplayLabel] were in 1 and 2 bedroom dwellings, and 18.2% in 4 or more bedroom dwellings, compared with 23.7% and 42.0% for Greater Sydney respectively.
The major differences between the number of bedrooms per dwelling for people [Toggles].[COIIDDisplayLabel] in Bayside Council area and Greater Sydney were:
- A larger percentage of people in 2 bedrooms (42.6% compared to 19.2%)
- A larger percentage of people in 0 or 1 bedrooms (8.7% compared to 4.5%)
- A smaller percentage of people in 4 bedrooms (12.0% compared to 28.7%)
- A smaller percentage of people in 5 bedrooms or more (6.2% compared to 13.3%)
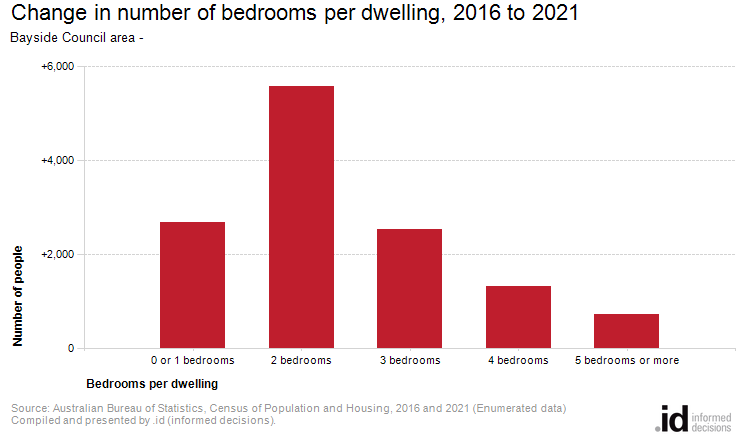
Emerging groups
The largest changes in the number of bedrooms per dwelling for people [Toggles].[COIIDDisplayLabel] in Bayside Council area between 2016 and 2021 were:
- 2 bedrooms (+5,587 persons)
- 0 or 1 bedrooms (+2,676 persons)
- 3 bedrooms (+2,527 persons)
- 4 bedrooms (+1,328 persons)