Blacktown City
Need for assistance - Dwelling type
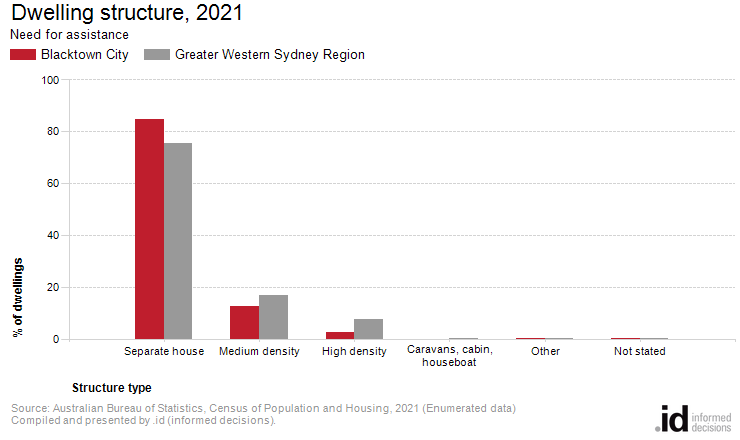
In Blacktown City 15.2% of people reporting a need for assistance were in medium or high density dwellings.
Dwelling Type is an important determinant of Blacktown City's residential role and function. For people with a disability, housing type can indicate the location where this community lives. It can also indicate the level of assistance with access to housing and transport required by the community.
Dwelling Type statistics should be viewed in conjunction with Household Type, Housing Tenure and Age Structure for a more complete picture of the housing market for people with a disability in Blacktown City.
Derived from the Census:
'Dwelling Structure is derived from the ABS address register supplemented with information from Census Field Officers.'
People with a need for assistance, counted in dwellings
| Dwelling structure | ||||||||
|---|---|---|---|---|---|---|---|---|
| Blacktown City - Need for assistance | 2021 | 2016 | Change | |||||
| Dwelling type | Number | % | Greater Western Sydney Region | Number | % | Greater Western Sydney Region | 2016 to 2021 | |
| Separate house | 16,563 | 84.6 | 75.5 | 12,923 | 82.1 | 75.3 | +3,640 | 27001 |
| Medium density | 2,462 | 12.6 | 16.7 | 2,352 | 14.9 | 17.5 | +110 | 27002 |
| High density | 510 | 2.6 | 7.4 | 375 | 2.4 | 6.5 | +135 | 27003 |
| Caravans, cabin, houseboat | 0 | -- | 0.1 | 41 | 0.3 | 0.1 | -41 | 27004 |
| Other | 10 | 0.1 | 0.1 | 29 | 0.2 | 0.3 | -19 | 27005 |
| Not stated | 26 | 0.1 | 0.2 | 26 | 0.2 | 0.3 | 0 | 27006 |
| Total people counted in occupied private dwellings | 19,571 | 100.0 | 100.0 | 15,746 | 100.0 | 100.0 | +3,825 | |
Source: Australian Bureau of Statistics, Census of Population and Housing (opens a new window) 2016 and 2021. Compiled and presented by .id (opens a new window)(informed decisions).
| Dwelling type | ||||||||
|---|---|---|---|---|---|---|---|---|
| Blacktown City - Need for assistance | 2021 | 2016 | Change | |||||
| Dwelling type | Number | % | Greater Western Sydney Region | Number | % | Greater Western Sydney Region | 2016 to 2021 | |
| Occupied private dwellings | 19,571 | 93.0 | 94.3 | 15,746 | 91.4 | 89.5 | +3,825 | 27500 |
| Non private dwellings | 1,467 | 7.0 | 5.7 | 1,489 | 8.6 | 10.5 | -22 | 27502 |
| Total people counted in occupied dwellings | 21,038 | 100.0 | 100.0 | 17,235 | 100.0 | 100.0 | +3,803 | |
Source: Australian Bureau of Statistics, Census of Population and Housing (opens a new window) 2016 and 2021. Compiled and presented by .id (opens a new window)(informed decisions).
Compiled and presented by .id (informed decisions).
Compiled and presented by .id (informed decisions).
Dominant groups
Analysis of the types of dwellings for people reporting a need for assistance in Blacktown City in 2021 shows that 84.6% of people with a need for assistance were in separate houses; 12.6% were medium density dwellings, and 2.6% were high density dwellings, compared with 75.5%, 16.7%, and 7.4% in the Greater Western Sydney Region respectively.
Emerging groups
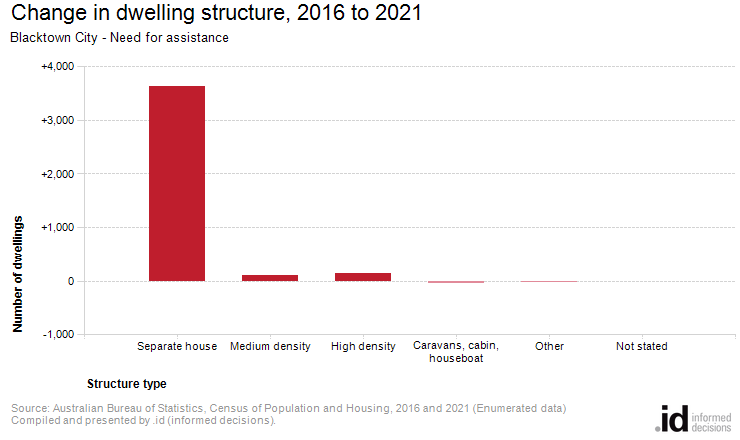
The total number of people reporting a need for assistance in dwellings in Blacktown City increased by 3,803 between 2016 and 2021.
The largest changes in the type of dwellings for people reporting a need for assistance in Blacktown City between 2016 and 2021 were:
- Separate house (+3,640 persons)
- High density (+135 persons)
- Medium density (+110 persons)