Bungarribee
Dwelling type
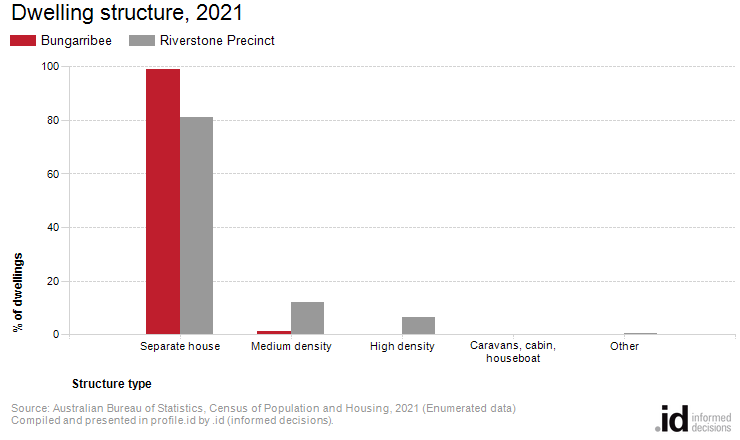
In Bungarribee, 1.1% of the dwellings were medium or high density, compared to 19% in Riverstone Precinct.
Dwelling Type is an important determinant of Bungarribee's residential role and function. A greater concentration of higher density dwellings is likely to attract more young adults and smaller households, often renting. Larger, detached or separate dwellings are more likely to attract families and prospective families. The residential built form often reflects market opportunities or planning policy, such as building denser forms of housing around public transport nodes or employment centres.
Dwelling Type statistics should be viewed in conjunction with Household Size, Household Types, Housing Tenure and Age Structure for a more complete picture of the housing market in Bungarribee.
If you're looking at this data to prepare a housing strategy, learn more here.
Derived from the Census:
'Dwelling Structure is derived from the ABS address register supplemented with information from Census Field Officers.'
Dwellings
| Dwelling structure | ||||||||
|---|---|---|---|---|---|---|---|---|
| Bungarribee - Dwellings (Enumerated) | 2021 | 2016 | Change | |||||
| Dwelling type | Number | % | Riverstone Precinct % | Number | % | Riverstone Precinct % | 2016 to 2021 | |
| Separate house | 810 | 98.9 | 81.1 | 704 | 98.2 | 69.5 | +106 | 27001 |
| 9 | 1.1 | 12.0 | 10 | 1.4 | 28.3 | -1 | 27002 | |
| 0 | 0.0 | 6.6 | 0 | 0.0 | 1.1 | 0 | 27003 | |
| Caravans, cabin, houseboat | 0 | 0.0 | -- | 0 | 0.0 | 0.4 | 0 | 27004 |
| Other | 0 | 0.0 | 0.1 | 3 | 0.4 | 0.3 | -3 | 27005 |
| Not stated | 0 | 0.0 | 0.3 | 0 | 0.0 | 0.4 | 0 | 27006 |
| Total Private Dwellings | 819 | 100.0 | 100.0 | 717 | 100.0 | 100.0 | +102 | |
Source: Australian Bureau of Statistics, Census of Population and Housing (opens a new window) 2016 and 2021. Compiled and presented by .id (opens a new window)(informed decisions).
(Enumerated data)
| Dwelling type | ||||||||
|---|---|---|---|---|---|---|---|---|
| Bungarribee | 2021 | 2016 | Change | |||||
| Dwelling type | Number | % | Riverstone Precinct % | Number | % | Riverstone Precinct % | 2016 to 2021 | |
| Occupied private dwellings | 813 | 98.9 | 96.0 | 699 | 97.4 | 96.1 | +114 | 27500 |
| Unoccupied private dwellings | 9 | 1.1 | 4.0 | 19 | 2.6 | 3.8 | -10 | 27501 |
| Non private dwellings | 0 | 0.0 | 0.0 | 0 | 0.0 | 0.1 | 0 | 27502 |
| Total dwellings | 822 | 100.0 | 100.0 | 718 | 100.0 | 100.0 | +104 | |
Source: Australian Bureau of Statistics, Census of Population and Housing (opens a new window) 2016 and 2021. Compiled and presented by .id (opens a new window)(informed decisions).
(Enumerated data)
Compiled and presented in profile.id by .id (informed decisions).
Compiled and presented in profile.id by .id (informed decisions).
Dominant groups
In 2021, there were 810 separate houses in the area, 9 medium density dwellings, and no high density dwellings.
Analysis of the types of dwellings in Bungarribee in 2021 shows that 98.9% of all dwellings were separate houses; 1.1% were medium density dwellings, and 0% were in high density dwellings, compared with 81.1%, 12.0%, and 6.6% in the Riverstone Precinct respectively.
In 2021, a total of 98.9% of the dwellings in Bungarribee were occupied on Census night, compared to 96.0% in Riverstone Precinct. The proportion of unoccupied dwellings was 1.1%, which is smaller compared to that found in Riverstone Precinct (4.0%).
Emerging groups
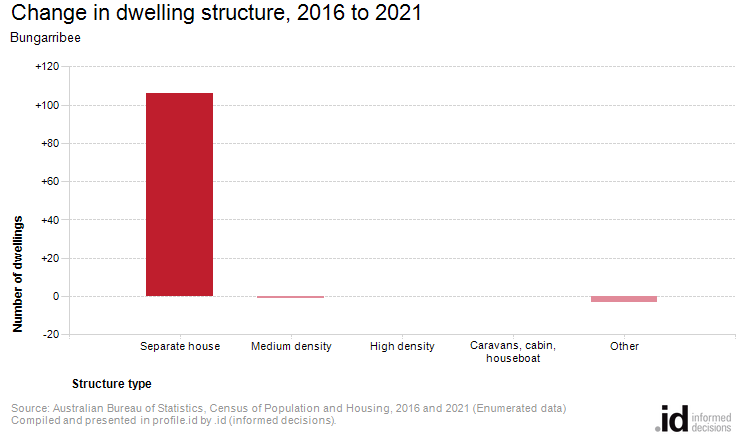
The total number of dwellings in Bungarribee increased by 104 between 2016 and 2021.
The largest change in the type of dwellings found in Bungarribee between 2016 and 2021 was:
- Separate house (+106 dwellings)