Blacktown City
Aboriginal and Torres Strait Islander profile - Household types
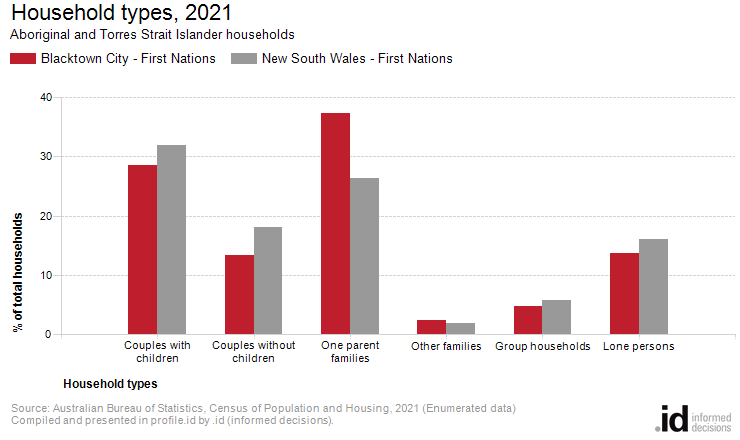
In Blacktown City, 29% of Aboriginal and Torres Strait Islander households are made up of couples with children compared with 32% of Aboriginal and Torres Strait Islander population households in New South Wales.
The household and family structure of the Aboriginal and Torres Strait Islander population is one of the most important demographic indicators. It provides insights into the level of demand for services and facilities targeted at particular household types, and the structure of the First Nations community. Across Australia, First Nations households are more likely to be larger families and one parent families, but this varies from area to area, so it is important to compare to the populations across geographic benchmarks.
Please note that this is a household topic. Households are counted as First Nations if they contain one or more Aboriginal or Torres Strait Islander persons present on Census night, who are usual residents of the household.
First Nations households cannot be visitor only or other non-classifiable households, so those categories are excluded from this topic. For that reason, percentage distributions may not match those in the main household types page of profile.id, which includes these categories.
To continue building the story, First Nations household type should be viewed in conjunction with Household Size, Age Structure and Number of Bedrooms .
Derived from the Census question:
‘What is the person’s relationship (to each other person in the household)?’
Occupied private dwellings containing family, group and lone person households
| Household types | ||||||||
|---|---|---|---|---|---|---|---|---|
| Aboriginal and Torres Strait Islander households - Blacktown City | 2021 | 2016 | Change | |||||
| Households by type | Number | % | New South Wales - First Nations % | Number | % | New South Wales - First Nations % | 2016 to 2021 | |
| Couples with children | 1,468 | 28.5 | 31.9 | 1,244 | 31.3 | 33.5 | +224 | 20510 |
| Couples without children | 686 | 13.3 | 18.1 | 539 | 13.5 | 16.7 | +147 | 20511 |
| One parent families | 1,919 | 37.3 | 26.3 | 1,498 | 37.6 | 27.7 | +421 | 20512 |
| Other families | 122 | 2.4 | 1.9 | 91 | 2.3 | 2.1 | +31 | 20513 |
| Group households | 244 | 4.7 | 5.8 | 159 | 4.0 | 6.2 | +85 | 20514 |
| Lone persons | 704 | 13.7 | 16.0 | 448 | 11.3 | 13.9 | +256 | 20515 |
| Total households | 5,143 | 100.0 | 100.0 | 3,979 | 100.0 | 100.0 | +1,164 | |
Source: Australian Bureau of Statistics, Census of Population and Housing (opens a new window) 2016 and 2021. Compiled and presented by .id (opens a new window)(informed decisions).
(Enumerated data)
Compiled and presented in profile.id by .id (informed decisions).
Compiled and presented in profile.id by .id (informed decisions).
Dominant groups
Analysis of the Aboriginal and Torres Strait Islander household types in Blacktown City in 2021 compared to the Aboriginal and Torres Strait Islander population households in New South Wales shows that there was a lower proportion of couple families with child(ren) as well as a higher proportion of one-parent families. Overall, 28.5% of total families were couple families with child(ren), and 37.3% were one-parent families, compared with 31.9% and 26.3% respectively for the Aboriginal and Torres Strait Islander population in New South Wales.
There were a lower proportion of lone person households and a lower proportion of couples without children. Overall, the proportion of lone person households was 13.7% compared to 16.0% in the Aboriginal and Torres Strait Islander population in New South Wales while the proportion of couples without children was 13.3% compared to 18.1% in the Aboriginal and Torres Strait Islander population households in New South Wales.
Emerging groups
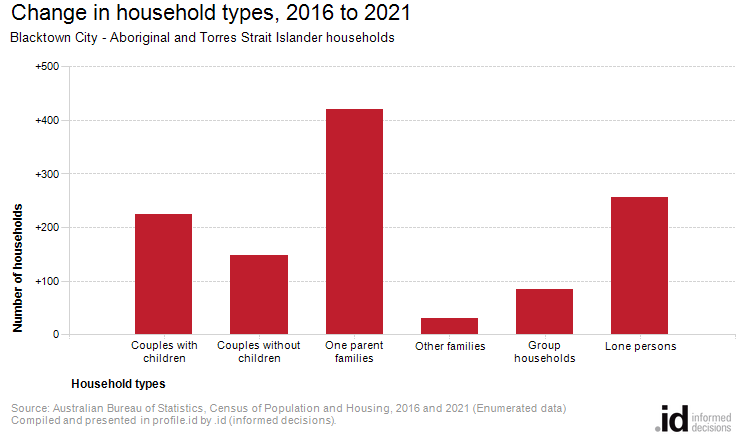
The number of Aboriginal and Torres Strait Islander households in Blacktown City increased by 1,164 between 2016 and 2021.
The largest changes in family/household types of the Aboriginal and Torres Strait Islander population in Blacktown City between 2016 and 2021 were:
- One parent families (+421 households)
- Lone persons (+256 households)
- Couples with children (+224 households)
- Couples without children (+147 households)