Woodcroft
Language used at home
In Woodcroft, 62.2226 of people used a language other than English at home in 2016.
Woodcroft's language statistics show the proportion of the population who use a language at home other than English. They indicate how culturally diverse a population is and the degree to which different ethnic groups and nationalities are retaining their language.
Woodcroft's language statistics should be analysed in conjunction with Country of Birth and Proficiency in English to assist in identifying specific cultural and ethnic groups in the area and the services required by the multicultural community.
Please note: Due to ABS rules regarding perturbation of data to protect the confidentiality of individuals, counts of individual language groups and totals derived from them may differ slightly from those published by the ABS.
Derived from the Census question:
'Does the person use a language other than English at home?'
Total population
| Language used at home - Summary | ||||||||
|---|---|---|---|---|---|---|---|---|
| Woodcroft - Total persons (Usual residence) | 2016 | 2011 | Change | |||||
| Language summary | Number | % | Ward 2 % | Number | % | Ward 2 % | 2011 to 2016 | |
| Speaks English only | 2,308 | 35.8 | 57.1 | 36500 | 2,220 | 34.6 | 62.4 | +88 |
| 4,009 | 62.2 | 38.7 | 36501 | 4,024 | 62.6 | 34.0 | -15 | |
| Not stated | 126 | 2.0 | 4.2 | 36502 | 179 | 2.8 | 3.6 | -53 |
| Total Population | 6,443 | 100.0 | 100.0 | 6,423 | 100.0 | 100.0 | +20 | |
Source: Australian Bureau of Statistics, Census of Population and Housing (opens a new window) 2011 and 2016. Compiled and presented by .id (opens a new window)(informed decisions).
| Language used at home - Ranked by size | ||||||||
|---|---|---|---|---|---|---|---|---|
| Woodcroft - Total persons (Usual residence) | 2016 | 2011 | Change | |||||
| Language (excludes English) | Number | % | Ward 2 % | Number | % | Ward 2 % | 2011 to 2016 | |
| 1,289 | 20.0 | 3.7 | 36011 | 1,423 | 22.2 | 3.5 | -134 | |
| 476 | 7.4 | 3.5 | 36016 | 488 | 7.6 | 3.1 | -12 | |
| 365 | 5.7 | 6.0 | 36088 | 271 | 4.2 | 4.0 | +94 | |
| 239 | 3.7 | 2.5 | 36004 | 203 | 3.2 | 2.9 | +36 | |
| Bengali | 124 | 1.9 | 0.8 | 36050 | 134 | 2.1 | 0.6 | -10 |
| 103 | 1.6 | 1.1 | 36006 | 126 | 2.0 | 1.2 | -23 | |
| 96 | 1.5 | 1.4 | 36035 | 81 | 1.3 | 1.0 | +15 | |
| Mandarin | 90 | 1.4 | 1.9 | 36007 | 65 | 1.0 | 1.2 | +25 |
| 87 | 1.4 | 1.3 | 36064 | 51 | 0.8 | 0.7 | +36 | |
| Turkish | 77 | 1.2 | 0.4 | 36036 | 93 | 1.4 | 0.5 | -16 |
| Spanish | 73 | 1.1 | 0.9 | 36034 | 92 | 1.4 | 0.9 | -19 |
| Polish | 60 | 0.9 | 0.6 | 36028 | 73 | 1.1 | 0.7 | -13 |
| Indonesian | 59 | 0.9 | 0.6 | 36018 | 70 | 1.1 | 0.5 | -11 |
| Dari | 52 | 0.8 | 0.5 | 36113 | 30 | 0.5 | 0.5 | +22 |
| Vietnamese | 45 | 0.7 | 0.2 | 36037 | 64 | 1.0 | 0.2 | -19 |
| 43 | 0.7 | 0.8 | 36108 | 50 | 0.8 | 0.6 | -7 | |
| Maltese | 40 | 0.6 | 0.4 | 36027 | 45 | 0.7 | 0.6 | -5 |
| Sinhalese | 39 | 0.6 | 0.9 | 36033 | 45 | 0.7 | 0.8 | -6 |
| Marathi | 35 | 0.5 | 0.2 | 36080 | 32 | 0.5 | 0.2 | +3 |
| Malayalam | 34 | 0.5 | 0.3 | 36077 | 28 | 0.4 | 0.2 | +6 |
| 31 | 0.5 | 0.3 | 36031 | 0 | 0.0 | 0.3 | +31 | |
| Nepali | 30 | 0.5 | 0.6 | 36081 | 22 | 0.3 | 0.3 | +8 |
| Burmese | 29 | 0.5 | 0.3 | 36053 | 25 | 0.4 | 0.2 | +4 |
| Korean | 24 | 0.4 | 0.9 | 36025 | 48 | 0.7 | 0.7 | -24 |
| Greek | 22 | 0.3 | 0.6 | 36015 | 21 | 0.3 | 0.7 | +1 |
| Croatian | 22 | 0.3 | 0.5 | 36009 | 27 | 0.4 | 0.5 | -5 |
| French | 21 | 0.3 | 0.3 | 36013 | 36 | 0.6 | 0.3 | -15 |
| Persian | 21 | 0.3 | 0.6 | 36019 | 39 | 0.6 | 0.6 | -18 |
| Telugu | 21 | 0.3 | 0.6 | 36099 | 12 | 0.2 | 0.3 | +9 |
| Fijian Hindustani | 19 | 0.3 | 0.0 | 36002 | 4 | 0.1 | 0.0 | +15 |
| Serbian | 16 | 0.2 | 0.3 | 36032 | 8 | 0.1 | 0.4 | +8 |
| Macedonian | 15 | 0.2 | 0.0 | 36026 | 19 | 0.3 | 0.1 | -4 |
| Russian | 14 | 0.2 | 0.3 | 36030 | 8 | 0.1 | 0.3 | +6 |
| Non-verbal so described | 13 | 0.2 | 0.3 | 36082 | 19 | 0.3 | 0.2 | -6 |
| Pashto | 13 | 0.2 | 0.1 | 36086 | 0 | 0.0 | 0.2 | +13 |
| Hungarian | 13 | 0.2 | 0.1 | 36017 | 17 | 0.3 | 0.2 | -4 |
| Italian | 12 | 0.2 | 0.8 | 36022 | 32 | 0.5 | 1.0 | -20 |
| Fijian | 12 | 0.2 | 0.1 | 36061 | 6 | 0.1 | 0.1 | +6 |
| Kannada | 11 | 0.2 | 0.1 | 36071 | 7 | 0.1 | 0.1 | +4 |
| Thai | 10 | 0.2 | 0.1 | 36102 | 15 | 0.2 | 0.1 | -5 |
| Show me more! | ||||||||
Excludes languages spoken at home by fewer than 10 people.
Compiled and presented in profile.id by .id (informed decisions).
Compiled and presented in profile.id by .id (informed decisions).
Dominant groups
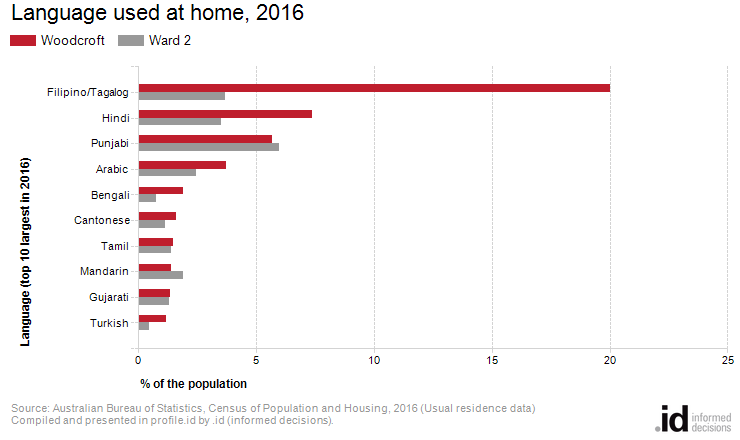
Analysis of the language used at home by the population of Woodcroft in 2016 compared to Ward 2 shows that there was a smaller proportion of people who used English only, and a larger proportion of those using a non-English language (either exclusively, or in addition to English).
Overall, 35.8% of the population used English only, and 62.2 used a non-English language, compared with 57.1% and 38.7% respectively for Ward 2.
The dominant language used at home, other than English, in Woodcroft was Filipino/Tagalog, with 20.0% of the population, or 1,289 people using this language at home.
The major differences between the languages used at home for the population of Woodcroft and Ward 2 in 2016 were:
- A larger percentage using Filipino/Tagalog at home (20.0% compared to 3.7%)
- A larger percentage using Hindi at home (7.4% compared to 3.5%)
- A larger percentage using Arabic at home (3.7% compared to 2.5%)
- A larger percentage using Bengali at home (1.9% compared to 0.8%)
Emerging groups
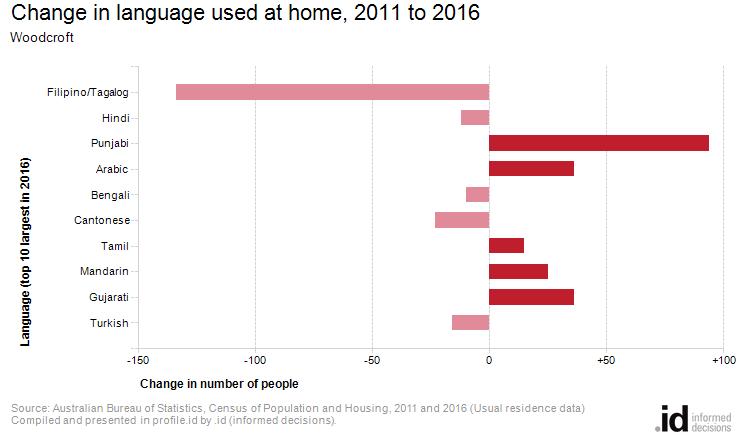
Between 2011 and 2016, the number of people who used a language other than English at home decreased by 15 or 0.4%, and the number of people who used English only increased by 88 or 4.0%.
The largest changes in the languages used by the population in Woodcroft between 2011 and 2016 were for those using:
- Filipino/Tagalog (-134 persons)
- Punjabi (+94 persons)