Blacktown City
Non-English speakers - Household size
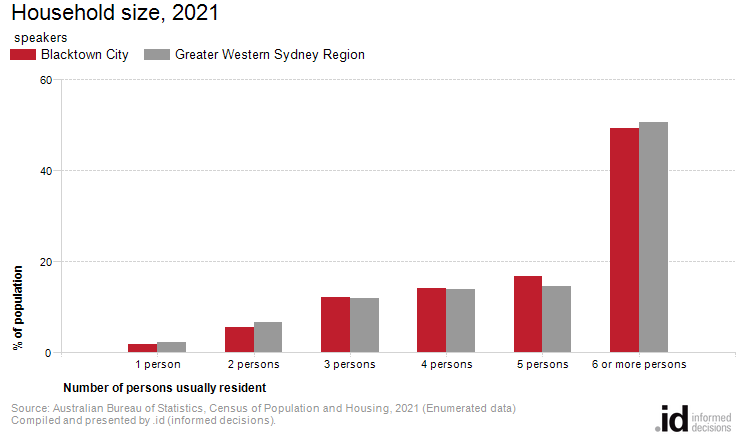
In Blacktown City, 49.3% of [Toggles].[COIIDDisplayLabel] speakers were found in households with 6 or more persons.
The size of households in general follows the life-cycle of families. Households are usually small at the stage of relationship formation (early marriage), and then increase in size with the advent of children. They later reduce in size again as these children reach adulthood and leave home.
Household size may differ significantly for non-English speaking populations. Some cultural groups may be affected by the availability of affordable housing, and may have a preference for living in larger households with extended family members. On the other hand, recent arrivals in student housing may have mainly 1 and 2 person households.
A comparison with Dwelling Type and Number of Bedrooms data may indicate whether overcrowding is an issue for non-English speaking populations.
Household size should be viewed in conjunction with Household Type, Age Structure, Dwelling Type, and Household Income.
Derived from the three Census questions:
'Name of each person including visitors who spent the night of Tuesday, 10 August 2021 in this dwelling', and 'Where does the person usually live?', and 'Name of each person who usually lives in this dwelling but was away on Tuesday, 10 August 2021.'
People using [COIIDLabelForLanguage] at home, counted in private dwellings
| Household size | ||||||||
|---|---|---|---|---|---|---|---|---|
| Blacktown City - [Toggles].[COIIDDisplayLabel] | 2021 | 2016 | Change | |||||
| Number of persons usually resident | Number | % | Greater Western Sydney Region | Number | % | Greater Western Sydney Region | 2016 to 2021 | |
| 1 person | 47 | 2.0 | 2.2 | 46 | 2.3 | 2.4 | +1 | 20001 |
| 2 persons | 136 | 5.7 | 6.8 | 123 | 6.1 | 6.5 | +13 | 20002 |
| 3 persons | 291 | 12.1 | 12.1 | 170 | 8.5 | 9.7 | +121 | 20003 |
| 4 persons | 343 | 14.3 | 13.9 | 274 | 13.7 | 13.2 | +69 | 20004 |
| 5 persons | 404 | 16.8 | 14.5 | 346 | 17.3 | 15.4 | +58 | 20005 |
| 6 or more persons | 1,186 | 49.3 | 50.6 | 1,042 | 52.1 | 52.8 | +144 | 20006 |
| Total people in classifiable households | 2,407 | 100.0 | 100.0 | 2,001 | 100.0 | 100.0 | +406 | |
Source: Australian Bureau of Statistics, Census of Population and Housing (opens a new window) 2016 and 2021. Compiled and presented by .id (opens a new window)(informed decisions).
Compiled and presented by .id (informed decisions).
Compiled and presented by .id (informed decisions).
Dominant groups
Analysis of the number of [Toggles].[COIIDDisplayLabel] speakers usually resident in a household in Blacktown City compared with Greater Western Sydney Region shows that there was a similar proportion of [Toggles].[COIIDDisplayLabel] speakers in lone person households, and a higher proportion in larger households (those with 4 persons or more). Overall there was 2.0% of [Toggles].[COIIDDisplayLabel] speakers in lone person households, and 80.3% in larger households, compared with 2.2% and 79.0% respectively for Greater Western Sydney Region.
The major differences between the household size for [Toggles].[COIIDDisplayLabel] speakers in Blacktown City and Greater Western Sydney Region were:
- A larger percentage of people in households with 5 persons usually resident (16.8% compared to 14.5%)
- A smaller percentage of people in households with 6 or more persons usually resident (49.3% compared to 50.6%)
- A smaller percentage of people in households with 2 persons usually resident (5.7% compared to 6.8%)
Emerging groups
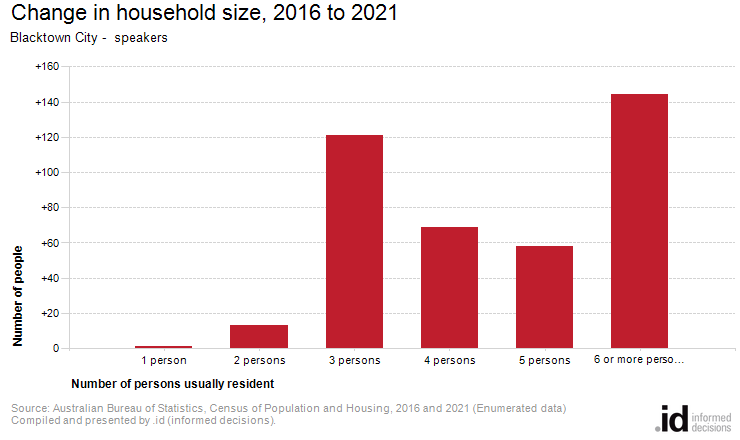
The number of [Toggles].[COIIDDisplayLabel] speakers in households in Blacktown City increased by 406 between 2016 and 2021.
The largest changes in the number of [Toggles].[COIIDDisplayLabel] speakers usually resident in a household in Blacktown City between 2016 and 2021 were:
- 6 or more persons (+144 persons)
- 3 persons (+121 persons)
- 4 persons (+69 persons)
- 5 persons (+58 persons)