Blacktown City
Sexes - Individual income
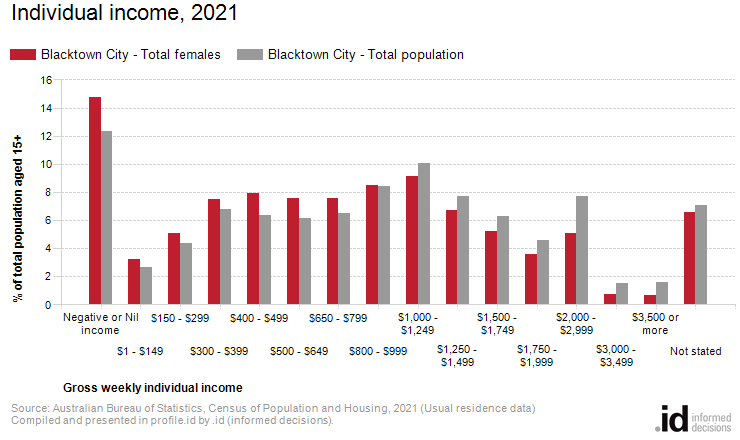
In Blacktown City, 6.5% of females earned $2,000 or more per week.
Individual income is a measure of the income a person receives from all sources.
Typically, male incomes are higher than female incomes. This conflates a number of factors and this topic should not be taken on its own to represent a measure of the "gender pay gap". Individual income for females often shows a high rate of "Nil Income", likely to be due to the rate of single-income families where the male is the main earner. This may differ from area to area, particularly with the prevalence of dual-income families increasing in many areas. Parts of income differences between the sexes may also be explained by comparing incomes to Hours Worked and Occupations. A gender pay gap may be apparent after accounting for these factors, but that is beyond the scope of analysis which can be done in profile.id.
Derived from the Census question:
'What is the total of all income the person usually receives?'
Total female population aged 15 years and over
| Individual income | |||||||
|---|---|---|---|---|---|---|---|
| Blacktown City - Total females aged 15+ | 2021 | ||||||
| Gross weekly individual income | Number | % | Blacktown City - Total population % | ||||
| Negative or Nil income | 22,874 | 14.8 | 12.3 | 29000 | |||
| $1 - $149 | 5,029 | 3.2 | 2.6 | 29002 | |||
| $150 - $299 | 7,873 | 5.1 | 4.4 | 29003 | |||
| $300 - $399 | 11,644 | 7.5 | 6.8 | 29004 | |||
| $400 - $499 | 12,325 | 8.0 | 6.3 | 29005 | |||
| $500 - $649 | 11,691 | 7.5 | 6.1 | 29006 | |||
| $650 - $799 | 11,708 | 7.6 | 6.5 | 29007 | |||
| $800 - $999 | 13,178 | 8.5 | 8.4 | 29008 | |||
| $1,000 - $1,249 | 14,188 | 9.2 | 10.0 | 29009 | |||
| $1,250 - $1,499 | 10,455 | 6.7 | 7.7 | 29010 | |||
| $1,500 - $1,749 | 8,142 | 5.3 | 6.3 | 29011 | |||
| $1,750 - $1,999 | 5,537 | 3.6 | 4.5 | 29012 | |||
| $2,000 - $2,999 | 7,909 | 5.1 | 7.7 | 29013 | |||
| $3,000 - $3,499 | 1,187 | 0.8 | 1.5 | 29014 | |||
| $3,500 or more | 1,034 | 0.7 | 1.6 | 29015 | |||
| Not stated | 10,224 | 6.6 | 7.1 | 29016 | |||
| Total persons aged 15+ | 154,998 | 100.0 | 100.0 | ||||
Source: Australian Bureau of Statistics, Census of Population and Housing (opens a new window) 2021. Compiled and presented by .id (opens a new window)(informed decisions).
Compiled and presented in profile.id by .id (informed decisions).
Dominant groups
Analysis of the female individual income levels in Blacktown City in 2021 compared to Blacktown City - Total population shows that there was a lower proportion earning a high income (those earning $2,000 per week or more) and a higher proportion of low income persons (those earning less than $500 per week).
Overall, 6.5% of females earned a high income, and 38.5% earned a low income, compared with 10.8% and 32.5% respectively for Blacktown City - Total population.
The major differences between the weekly income of females in Blacktown City and Blacktown City - Total population were:
- A larger percentage of females who earned Negative or Nil income (14.8% compared to 12.3%)
- A larger percentage of females who earned $400 - $499 (8.0% compared to 6.3%)
- A larger percentage of females who earned $500 - $649 (7.5% compared to 6.1%)
- A smaller percentage of females who earned $2,000 - $2,999 (5.1% compared to 7.7%)