Campbelltown
Number of bedrooms per dwelling
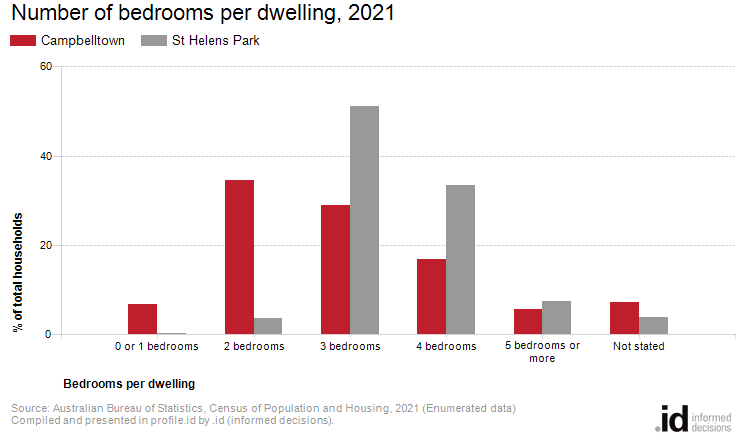
Dwellings with 2 bedrooms were the most common in Campbelltown in 2021.
The Number of Bedrooms in a dwelling is an indicator of the size of dwellings, and when combined with Dwelling Type information, provides insight into the role Campbelltown plays in the housing market. For example, an area of high density dwellings that are predominantly 1-2 bedroom are likely to attract students, single workers and young couples, whereas a high density area with dwellings that are predominantly 2-3 bedroom may attract more empty nesters and some families.
In combination with Household Type and Household Size, the Number of Bedrooms can also indicate issues around housing affordability, overcrowding and other socio-economic factors.
Derived from the Census question:
'How many bedrooms are there in this dwelling?'
Occupied private dwellings
| Number of bedrooms per dwelling | ||||||||
|---|---|---|---|---|---|---|---|---|
| Campbelltown - Households (Enumerated) | 2021 | 2016 | Change | |||||
| Number of bedrooms | Number | % | St Helens Park % | Number | % | St Helens Park % | 2016 to 2021 | |
| 0 or 1 bedrooms | 453 | 6.8 | 0.2 | 315 | 6.3 | 0.8 | +138 | 21001 |
| 2,314 | 34.5 | 3.8 | 1,533 | 30.7 | 3.4 | +781 | 21003 | |
| 3 bedrooms | 1,933 | 28.8 | 51.2 | 1,753 | 35.2 | 52.3 | +180 | 21004 |
| 1,133 | 16.9 | 33.4 | 788 | 15.8 | 32.2 | +345 | 21005 | |
| 5 bedrooms or more | 385 | 5.7 | 7.5 | 185 | 3.7 | 6.1 | +200 | 21006 |
| Not stated | 486 | 7.2 | 3.9 | 413 | 8.3 | 5.2 | +73 | 21007 |
| Total households | 6,704 | 100.0 | 100.0 | 4,987 | 100.0 | 100.0 | +1,717 | |
Source: Australian Bureau of Statistics, Census of Population and Housing (opens a new window) 2016 and 2021. Compiled and presented by .id (opens a new window)(informed decisions).
(Enumerated data)
Compiled and presented in profile.id by .id (informed decisions).
Compiled and presented in profile.id by .id (informed decisions).
Dominant groups
Analysis of the number of bedrooms in dwellings in Campbelltown in 2021 compared to St Helens Park shows that there was a higher proportion of dwellings with 2 bedrooms or less, and a lower proportion of dwellings with 4 or more bedrooms.
Overall, 41.3% of households were in dwellings with 2 bedrooms or less, and 22.6% of 4 or more bedroom dwellings, compared with 4.0% and 40.9% for St Helens Park respectively.
The major differences between the number of bedrooms per dwelling of Campbelltown and St Helens Park were:
- A larger percentage of 2 bedroom dwellings (34.5% compared to 3.8%)
- A larger percentage of dwellings with 1 or no bedrooms (includes bedsitters) (6.8% compared to 0.2%)
- A smaller percentage of 3 bedroom dwellings (28.8% compared to 51.2%)
- A smaller percentage of 4 bedroom dwellings (16.9% compared to 33.4%)
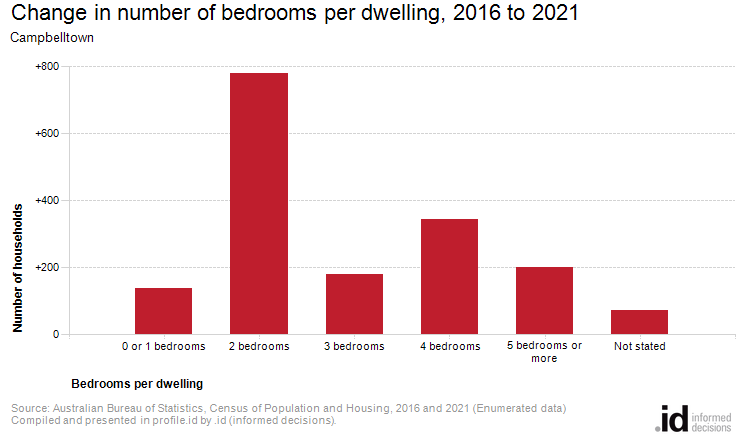
Emerging groups
The largest changes in the number of bedrooms per dwelling in Campbelltown between 2016 and 2021 were:
- 2 bedrooms (+781 dwellings)
- 4 bedrooms (+345 dwellings)
- 5 bedrooms or more (+200 dwellings)
- 3 bedrooms (+180 dwellings)