Ruse
Employment status
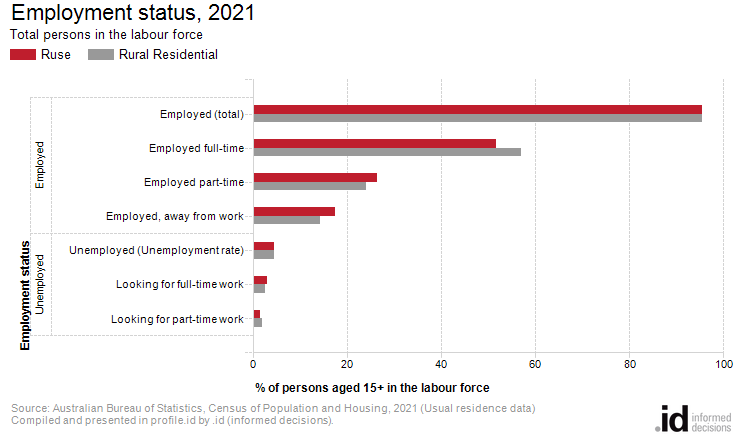
2,447 people living in Ruse in 2021 were employed, of which 54% worked full-time and 28% part-time.
Ruse's employment statistics are an important indicator of socio-economic status. The levels of full or part-time employment, unemployment and labour force participation indicate the strength of the local economy and social characteristics of the population. Employment status is linked to a number of factors including Age Structure, which influences the number of people in the workforce; the economic base and employment opportunities available in the area and; the education and skill base of the population (Occupations, Industries, Qualifications).
The two most important measures are:
- Unemployment rate - the number of people looking for work, as a percentage of the labour force (employed and unemployed over 15)
- Participation rate - the labour force expressed as a percentage of the total population over 15
Please note that in the 2021 Census, due to the COVID pandemic and lockdowns in many areas, the proportion of people who were employed but away from work in the week before Census has increased. We have no information on whether these people were normally employed full or part time so this is shown separately.
Derived from the Census question:
'Last week did the person have a full time or part time job of any kind?'
Persons aged 15 years and over
| Labour force status | ||||||||
|---|---|---|---|---|---|---|---|---|
| Ruse - Persons aged 15+ (Usual residence) | 2021 | 2006 | Change | |||||
| Labour force status | Number | % | Rural Residential % | Number | % | Rural Residential % | 2006 to 2021 | |
| 2,565 | 57.2 | 58.6 | 3,240 | 71.9 | 63.4 | -675 | 13500 | |
| Not in the labour force | 1,754 | 39.1 | 35.0 | 1,085 | 24.1 | 32.8 | +669 | 13501 |
| Labour force status not stated | 163 | 3.6 | 6.4 | 179 | 4.0 | 3.8 | -16 | 13502 |
| Total persons aged 15+ | 4,482 | 100.0 | 100.0 | 4,504 | 100.0 | 100.0 | -22 | |
Source: Australian Bureau of Statistics, Census of Population and Housing (opens a new window) 2006 and 2021. Compiled and presented by .id (opens a new window)(informed decisions).
(Usual residence data)
| Employment status | ||||||||
|---|---|---|---|---|---|---|---|---|
| Ruse - Persons in the labour force (Usual residence) | 2021 | 2006 | Change | |||||
| Employment status | Number | % | Rural Residential % | Number | % | Rural Residential % | 2006 to 2021 | |
| Employed | 2,447 | 95.4 | 95.5 | 3,081 | 95.1 | 96.2 | -634 | 13000 |
| Employed full-time | 1,323 | 51.6 | 57.0 | 2,051 | 63.3 | 61.7 | -728 | 13001 |
| Employed part-time | 675 | 26.3 | 24.2 | 828 | 25.6 | 26.6 | -153 | 13002 |
| Employed, away from work | 449 | 17.5 | 14.3 | 202 | 6.2 | 7.9 | +247 | 13003 |
| 118 | 4.6 | 4.5 | 159 | 4.9 | 3.8 | -41 | 13004 | |
| Looking for full-time work | 80 | 3.1 | 2.5 | 107 | 3.3 | 2.8 | -27 | 13005 |
| Looking for part-time work | 38 | 1.5 | 2.0 | 52 | 1.6 | 1.0 | -14 | 13006 |
| Total labour force | 2,565 | 100.0 | 100.0 | 3,240 | 100.0 | 100.0 | -675 | |
Source: Australian Bureau of Statistics, Census of Population and Housing (opens a new window) 2006 and 2021. Compiled and presented by .id (opens a new window)(informed decisions).
(Usual residence data)
Compiled and presented in profile.id by .id (informed decisions).
Compiled and presented in profile.id by .id (informed decisions).
Dominant groups
The size of Ruse's labour force in 2021 was 2,565, of which 675 were employed part-time and 1,323 were full time workers.
Analysis of the employment status (as a percentage of the labour force) in Ruse in 2021 compared to Rural Residential shows that there was a similar proportion in employment, as well as a similar proportion unemployed. Overall, 95.4% of the labour force was employed, and 4.6% unemployed, compared with 95.5% and 4.5% respectively for Rural Residential.
Analysis of the labour force participation rate of the population in Ruse in 2021 shows that there was a lower proportion in the labour force (57.2%) compared with Rural Residential (58.6%).
Emerging groups
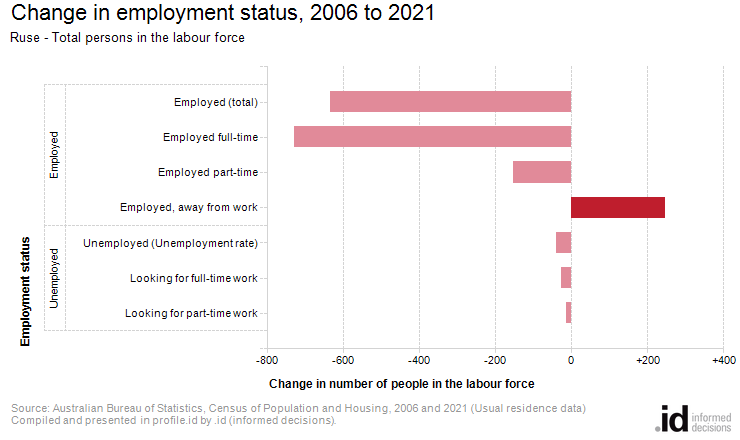
Between 2006 and 2021, the number of people employed in Ruse showed a decrease of 634, and the number unemployed showed a decrease of 41. In the same period, the number of people in the labour force showed a decrease of 675 or 20.8%.