Campbelltown City
Household income
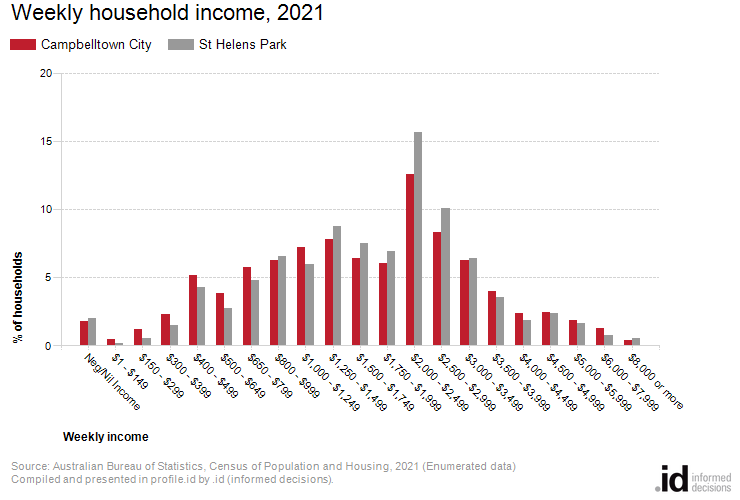
In Campbelltown City, 18.6% of households earned an income of $3,000 or more per week in 2021.
Households form the common 'economic unit' in our society. Campbelltown City's Household Income is one of the most important indicators of socio-economic status. With other data sources, such as Qualifications and Occupation, it helps to reveal the economic opportunities and socio-economic status of Campbelltown City. It is important to note that income data is not necessarily a measure of wealth. For example, if an area has a large number of retirees this will produce a higher proportion of households with low income but the retirees may have large capital wealth. For this reason, household income should be viewed in conjunction with Age and Household Composition.
The incomes presented on this page are for the latest Census year only. For comparison of incomes over time, go to Household Income Quartiles.
Learn more about the characteristics of low-income households here.
Derived from the Census question:
'What is the total of all wages/salaries, government benefits, pensions, allowances and other income the person usually receives?'
Households
| Weekly household income | |||||||
|---|---|---|---|---|---|---|---|
| Campbelltown City - Total households (Enumerated) | 2021 | ||||||
| Weekly income | Number | % | St Helens Park % | ||||
| Neg/Nil Income | 1,023 | 1.8 | 2.0 | 28001 | |||
| $1 - $149 | 276 | 0.5 | 0.2 | 28002 | |||
| $150 - $299 | 703 | 1.2 | 0.6 | 28003 | |||
| $300 - $399 | 1,330 | 2.3 | 1.5 | 28004 | |||
| $400 - $499 | 2,989 | 5.2 | 4.3 | 28005 | |||
| $500 - $649 | 2,207 | 3.8 | 2.8 | 28006 | |||
| $650 - $799 | 3,303 | 5.7 | 4.8 | 28007 | |||
| $800 - $999 | 3,598 | 6.2 | 6.5 | 28009 | |||
| $1,000 - $1,249 | 4,160 | 7.2 | 6.0 | 28010 | |||
| $1,250 - $1,499 | 4,498 | 7.8 | 8.7 | 28011 | |||
| $1,500 - $1,749 | 3,702 | 6.4 | 7.5 | 28012 | |||
| $1,750 - $1,999 | 3,495 | 6.1 | 6.9 | 28013 | |||
| $2,000 - $2,499 | 7,231 | 12.6 | 15.6 | 28014 | |||
| $2,500 - $2,999 | 4,792 | 8.3 | 10.1 | 28015 | |||
| $3,000 - $3,499 | 3,615 | 6.3 | 6.4 | 28016 | |||
| $3,500 - $3,999 | 2,305 | 4.0 | 3.6 | 28017 | |||
| $4,000 - $4,499 | 1,356 | 2.4 | 1.9 | 28018 | |||
| $4,500 - $4,999 | 1,407 | 2.4 | 2.4 | 28019 | |||
| $5,000 - $5,999 | 1,072 | 1.9 | 1.6 | 28020 | |||
| $6,000 - $7,999 | 736 | 1.3 | 0.7 | 28021 | |||
| $8,000 or more | 223 | 0.4 | 0.5 | 28022 | |||
| Not stated | 3,589 | 6.2 | 5.4 | 28098 | |||
| Total households | 57,610 | 100.0 | 100.0 | ||||
Source: Australian Bureau of Statistics, Census of Population and Housing (opens a new window) 2021. Compiled and presented in profile.id by .id (opens a new window)(informed decisions).
Compiled and presented in profile.id by .id (informed decisions).
Dominant groups
Analysis of household income levels in Campbelltown City in 2021 compared to St Helens Park shows that there was a larger proportion of high income households (those earning $3,000 per week or more) and a higher proportion of low income households (those earning less than $800 per week).
Overall, 18.5976% of the households earned a high income and 20.5363% were low income households, compared with 17.168% and 16.1037% respectively for St Helens Park.
The major differences between the household incomes of Campbelltown City and St Helens Park were:
- A larger percentage of households who earned $1,000 - $1,249 (7.2% compared to 6.0%)
- A smaller percentage of households who earned $2,000 - $2,499 (12.6% compared to 15.6%)
- A smaller percentage of households who earned $2,500 - $2,999 (8.3% compared to 10.1%)
- A smaller percentage of households who earned $1,500 - $1,749 (6.4% compared to 7.5%)