Nillumbik Shire
Need for assistance - Five year age groups
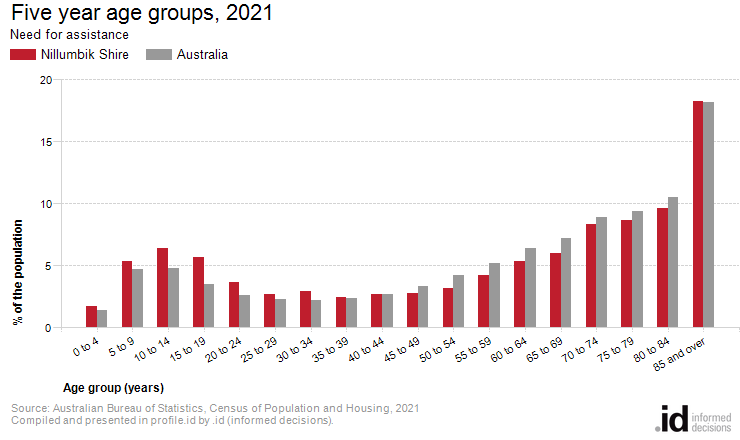
There were 2526 people with a need for assistance living in Nillumbik Shire, with largest age group being 85 and over year olds in 2021.
The age structure of the population with a need for assistance is an important indicator of whether the disabilities highlighted are age related or otherwise. Generally need for assistance increases with age, so a comparison with the age structure of the same population in a benchmark area may reveal an older or younger population with significant need for assistance.
Five year age groups present a classic age profile of the population. Each age group covers exactly five years, which enables direct comparison between each group.
To get a more complete picture Nillumbik Shire's Age Structure for those with a need for assistance should be viewed in conjunction with Dwelling Types, Tenure and Employment Status.
Derived from the Census question:
'What is the person's date of birth or age?'
People with a need for assistance
| Five year age groups | ||||||||
|---|---|---|---|---|---|---|---|---|
| Nillumbik Shire - Need for assistance | 2021 | 2011 | Change | |||||
| Five year age groups (years) | Number | % | Australia | Number | % | Australia | 2011 to 2021 | |
| 0 to 4 | 44 | 1.7 | 1.4 | 29 | 2.0 | 1.4 | +15 | 10 |
| 5 to 9 | 136 | 5.4 | 4.7 | 104 | 7.0 | 3.5 | +32 | 11 |
| 10 to 14 | 161 | 6.4 | 4.8 | 93 | 6.3 | 3.5 | +68 | 12 |
| 15 to 19 | 144 | 5.7 | 3.5 | 88 | 5.9 | 2.7 | +56 | 13 |
| 20 to 24 | 92 | 3.6 | 2.6 | 63 | 4.3 | 2.0 | +29 | 14 |
| 25 to 29 | 68 | 2.7 | 2.3 | 43 | 2.9 | 1.9 | +25 | 15 |
| 30 to 34 | 74 | 2.9 | 2.2 | 31 | 2.1 | 2.0 | +43 | 16 |
| 35 to 39 | 61 | 2.4 | 2.4 | 46 | 3.1 | 2.6 | +15 | 17 |
| 40 to 44 | 68 | 2.7 | 2.7 | 46 | 3.1 | 3.5 | +22 | 18 |
| 45 to 49 | 71 | 2.8 | 3.4 | 66 | 4.5 | 4.2 | +5 | 19 |
| 50 to 54 | 80 | 3.2 | 4.3 | 71 | 4.8 | 5.2 | +9 | 20 |
| 55 to 59 | 106 | 4.2 | 5.2 | 71 | 4.8 | 6.0 | +35 | 21 |
| 60 to 64 | 135 | 5.3 | 6.4 | 89 | 6.0 | 7.7 | +46 | 22 |
| 65 to 69 | 152 | 6.0 | 7.2 | 83 | 5.6 | 6.9 | +69 | 23 |
| 70 to 74 | 211 | 8.4 | 8.9 | 59 | 4.0 | 7.3 | +152 | 24 |
| 75 to 79 | 219 | 8.7 | 9.4 | 91 | 6.1 | 8.9 | +128 | 25 |
| 80 to 84 | 243 | 9.6 | 10.5 | 153 | 10.3 | 11.5 | +90 | 26 |
| 85 and over | 461 | 18.3 | 18.2 | 254 | 17.2 | 19.3 | +207 | 27 |
| Total persons | 2,526 | 100.0 | 100.0 | 1,480 | 100.0 | 100.0 | +1,046 | |
Source: Australian Bureau of Statistics, Census of Population and Housing (opens a new window) 2011 and 2021. Compiled and presented by .id (opens a new window)(informed decisions).
Compiled and presented in profile.id by .id (informed decisions).
Compiled and presented in profile.id by .id (informed decisions).
Dominant groups
Analysis of the population needing assistance in Nillumbik Shire in 2021 compared to Australia shows that there was a higher proportion of people in the younger age groups (under 15) and a lower proportion of people in the older age groups (65+).
Overall, 13.4996% of the population needing assistance was aged between 0 and 14, and 50.9105% were aged 65 years and over, compared with 10.9506% and 54.1702% respectively for Australia.
The major differences between the age structure of the population needing assistance Nillumbik Shire and Australia were:
- A larger percentage of people aged 15 to 19 (5.7% compared to 3.5%)
- A larger percentage of people aged 10 to 14 (6.4% compared to 4.8%)
- A smaller percentage of people aged 65 to 69 (6.0% compared to 7.2%)
- A smaller percentage of people aged 50 to 54 (3.2% compared to 4.3%)
Emerging groups
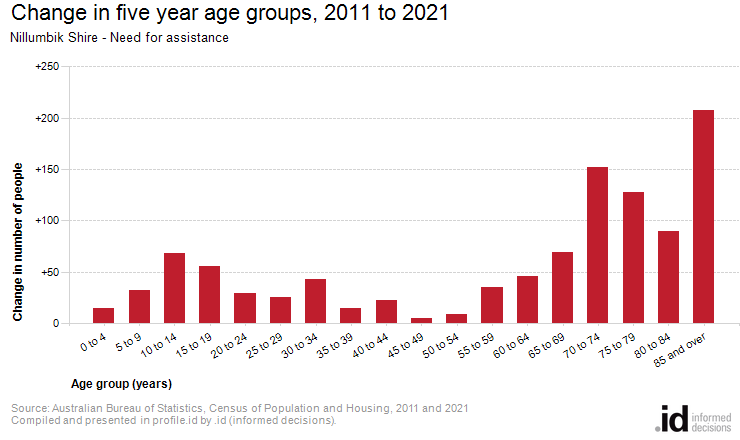
From 2011 to 2021, Nillumbik Shire's population needing assistance increased by 1046 people (70.6756756756757%). This represents an average annual population change of 5.49142601392221% per year over the period.
The largest changes in age structure of the population needing assistance in this area between 2011 and 2021 were in the age groups:
- 85 and over (+207 persons)
- 70 to 74 (+152 persons)
- 75 to 79 (+128 persons)
- 80 to 84 (+90 persons)