Bilgola
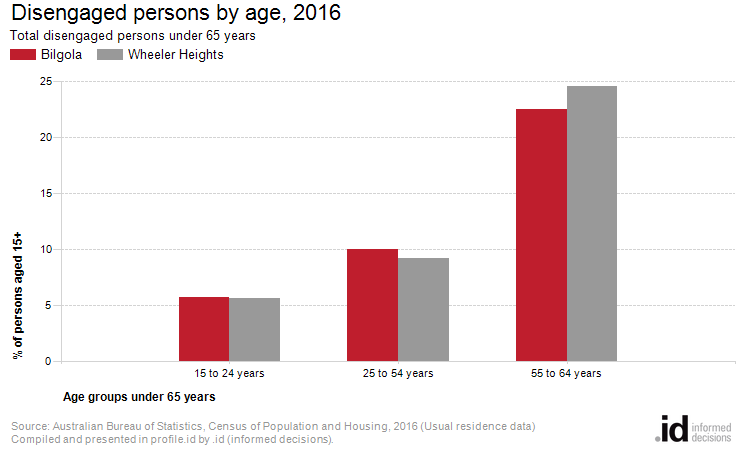
Disengagement by age
In 2016, 5.7% of 15 to 24 year olds in Bilgola were disengaged with employment and education, compared to 5.6% in Wheeler Heights.
Engagement in employment and education looks at the level of participation by age and sex of the population in the labour market, or full or part-time education. A full time employed or full-time student would be "Fully engaged", while part-time students may be fully engaged if they are also employed, or partly engaged if they are not working. Engagement in the labour and education market is highly dependent on age. Retirees are generally disengaged, while stay-at-home parents are also likely to be disengaged. The rate of engagement, particularly in the younger and working age groups can be affected by access to strong employment and education markets and is a measure of socio-economic status and the level of welfare dependency in an area. For more detail on employment and educational characteristics associated with disengagement, please look at Employment Status, Qualifications and Educational Institution Attending.
Further reading: Using demographics to inform gender equality
Derived from the two Census questions:
'Last week did the person have a full time or part time job of any kind?' and 'What type of educational institution is the person attending?'
| Workforce and educational engagement by age | ||||||||||
|---|---|---|---|---|---|---|---|---|---|---|
| Bilgola - Persons aged 15+ (Usual residence) | 2016 | 2011 | Change | |||||||
| Age group | Engagement status | Number | % | Wheeler Heights % | Number | % | Wheeler Heights % | 2011 to 2016 | ||
| 15 to 24 years | Fully engaged | 287 | 81.3 | 85.4 | 332 | 88.7 | 89.0 | -45 | 17010 | 17100 |
| 15 to 24 years | Partially engaged | 35 | 9.9 | 7.0 | 27 | 7.3 | 7.0 | +8 | 17020 | 17100 |
| 15 to 24 years | Disengaged | 20 | 5.7 | 5.6 | 12 | 3.3 | 4.0 | +8 | 17030 | 17100 |
| 15 to 24 years | Undetermined/Not stated | 11 | 3.1 | 2.0 | 2 | 0.7 | -- | +8 | 17040 | 17100 |
| 15 to 24 years | Total | 353 | 100.0 | 100.0 | 374 | 100.0 | 100.0 | -22 | 17099 | 17100 |
| 25 to 54 years | Fully engaged | 762 | 57.8 | 61.3 | 746 | 56.0 | 58.0 | +15 | 17010 | 17200 |
| 25 to 54 years | Partially engaged | 383 | 29.1 | 25.9 | 344 | 25.8 | 28.1 | +39 | 17020 | 17200 |
| 25 to 54 years | Disengaged | 132 | 10.0 | 9.2 | 187 | 14.0 | 11.3 | -55 | 17030 | 17200 |
| 25 to 54 years | Undetermined/Not stated | 41 | 3.1 | 3.6 | 56 | 4.2 | 2.7 | -15 | 17040 | 17200 |
| 25 to 54 years | Total | 1,318 | 100.0 | 100.0 | 1,334 | 100.0 | 100.0 | -16 | 17099 | 17200 |
| 55 to 64 years | Fully engaged | 267 | 44.5 | 41.1 | 234 | 44.2 | 47.0 | +32 | 17010 | 17300 |
| 55 to 64 years | Partially engaged | 185 | 30.8 | 25.6 | 150 | 28.4 | 25.5 | +34 | 17020 | 17300 |
| 55 to 64 years | Disengaged | 135 | 22.5 | 24.6 | 133 | 25.1 | 25.0 | +2 | 17030 | 17300 |
| 55 to 64 years | Undetermined/Not stated | 13 | 2.2 | 8.8 | 11 | 2.3 | 2.5 | +1 | 17040 | 17300 |
| 55 to 64 years | Total | 600 | 100.0 | 100.0 | 530 | 100.0 | 100.0 | +70 | 17099 | 17300 |
| 65 years and over | Fully engaged | 56 | 8.0 | 6.0 | 46 | 8.3 | 5.1 | +9 | 17010 | 17400 |
| 65 years and over | Partially engaged | 112 | 16.1 | 11.1 | 61 | 10.9 | 13.2 | +50 | 17020 | 17400 |
| 65 years and over | Disengaged | 502 | 72.0 | 76.9 | 414 | 73.5 | 78.7 | +87 | 17030 | 17400 |
| 65 years and over | Undetermined/Not stated | 27 | 3.9 | 6.0 | 41 | 7.3 | 3.1 | -14 | 17040 | 17400 |
| 65 years and over | Total | 697 | 100.0 | 100.0 | 564 | 100.0 | 100.0 | +133 | 17099 | 17400 |
| Total aged 15+ | Fully engaged | 1,372 | 46.2 | 52.3 | 1,359 | 48.5 | 50.3 | +12 | 17010 | 17999 |
| Total aged 15+ | Partially engaged | 715 | 24.1 | 20.1 | 583 | 20.8 | 22.4 | +131 | 17020 | 17999 |
| Total aged 15+ | Disengaged | 789 | 26.6 | 23.2 | 747 | 26.7 | 25.0 | +42 | 17030 | 17999 |
| Total aged 15+ | Undetermined/Not stated | 92 | 3.1 | 4.4 | 112 | 4.0 | 2.4 | -20 | 17040 | 17999 |
| Total aged 15+ | Total | 2,968 | 100.0 | 100.0 | 2,803 | 100.0 | 100.0 | +164 | 17099 | 17999 |
Source: Australian Bureau of Statistics, Census of Population and Housing (opens a new window) 2011 and 2016. Compiled and presented by .id (opens a new window)(informed decisions).
(Usual residence data)
Compiled and presented in profile.id by .id (informed decisions).
Compiled and presented in profile.id by .id (informed decisions).
Dominant groups
The number of people aged 15 to 24 years in Bilgola in 2016 was 353, of this, 5.7% were disengaged and 9.9% were partially engaged, compared to 5.6% and 7.0% respectively for Wheeler Heights.
Emerging groups
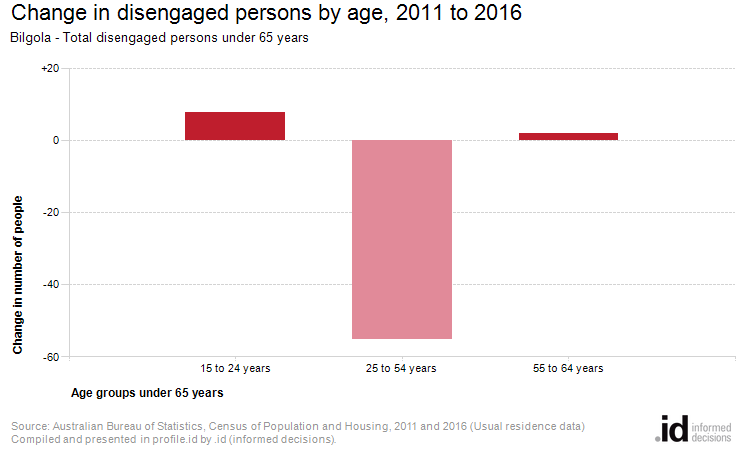
Between 2011 and 2016, the number of people 15 to 24 years in Bilgola showed a decrease of -22.
The number of disengaged people aged 15 to 24 years showed an increase of 8 or 66.7%.