Allambie Heights
Industry sector of employment
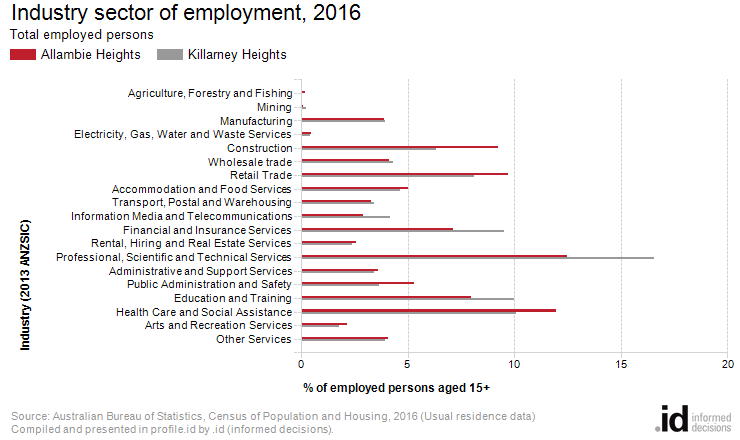
More Allambie Heights residents worked in professional, scientific and technical services than any other industry in 2016.
Allambie Heights's industry statistics identify the industry sectors in which the residents work (which may be within the residing area or elsewhere). This will be influenced by the skill base and socio-economic status of the residents as well as the industries and employment opportunities present in the region.
When viewed in conjunction with Residents Place of Work data and Method of Travel to Work, industry sector statistics provide insights into the relationship between the economic and residential role of the area.
Derived from the two Census questions:
'What best describes the business of your employer?' and 'What are the main goods produced or main services provided by your employers business?'
Employed persons aged 15 years and over
| Industry sector of employment | ||||||||
|---|---|---|---|---|---|---|---|---|
| Allambie Heights - Employed persons (Usual residence) | 2016 | 2011 | Change | |||||
| Industry sector | Number | % | Killarney Heights % | Number | % | Killarney Heights % | 2011 to 2016 | |
| Agriculture, Forestry and Fishing | 6 | 0.2 | -- | 6 | 0.2 | -- | 0 | 14001 |
| Mining | 3 | 0.1 | 0.2 | 0 | -- | -- | +3 | 14002 |
| Manufacturing | 128 | 3.9 | 3.9 | 190 | 6.2 | 5.4 | -62 | 14003 |
| Electricity, Gas, Water and Waste Services | 16 | 0.5 | 0.4 | 8 | 0.3 | 0.2 | +8 | 14004 |
| Construction | 306 | 9.2 | 6.3 | 275 | 8.9 | 6.0 | +30 | 14005 |
| Wholesale trade | 137 | 4.1 | 4.3 | 196 | 6.4 | 5.5 | -59 | 14006 |
| Retail Trade | 321 | 9.7 | 8.1 | 321 | 10.4 | 8.7 | 0 | 14007 |
| Accommodation and Food Services | 166 | 5.0 | 4.6 | 136 | 4.4 | 4.4 | +30 | 14008 |
| Transport, Postal and Warehousing | 108 | 3.3 | 3.4 | 103 | 3.4 | 2.7 | +5 | 14009 |
| Information Media and Telecommunications | 97 | 2.9 | 4.2 | 130 | 4.2 | 5.6 | -33 | 14010 |
| Financial and Insurance Services | 236 | 7.1 | 9.5 | 220 | 7.2 | 8.5 | +15 | 14011 |
| Rental, Hiring and Real Estate Services | 86 | 2.6 | 2.4 | 64 | 2.1 | 2.2 | +21 | 14012 |
| Professional, Scientific and Technical Services | 414 | 12.5 | 16.5 | 376 | 12.2 | 17.7 | +38 | 14013 |
| Administrative and Support Services | 120 | 3.6 | 3.4 | 89 | 2.9 | 3.3 | +30 | 14014 |
| Public Administration and Safety | 175 | 5.3 | 3.6 | 150 | 4.9 | 3.2 | +24 | 14015 |
| Education and Training | 264 | 8.0 | 10.0 | 250 | 8.1 | 8.9 | +14 | 14016 |
| Health Care and Social Assistance | 396 | 12.0 | 10.1 | 330 | 10.7 | 10.1 | +66 | 14017 |
| Arts and Recreation Services | 72 | 2.2 | 1.8 | 64 | 2.1 | 2.1 | +8 | 14018 |
| Other Services | 135 | 4.1 | 3.9 | 120 | 3.9 | 4.1 | +14 | 14019 |
| Inadequately described or not stated | 125 | 3.8 | 3.1 | 45 | 1.5 | 1.4 | +80 | 14020 |
| Total employed persons aged 15+ | 3,316 | 100.0 | 100.0 | 3,083 | 100.0 | 100.0 | +233 | |
Source: Australian Bureau of Statistics, Census of Population and Housing (opens a new window) 2011 and 2016. Compiled and presented by .id (opens a new window)(informed decisions).
(Usual residence data)
Compiled and presented in profile.id by .id (informed decisions).
Compiled and presented in profile.id by .id (informed decisions).
Dominant groups
An analysis of the jobs held by the resident population in Allambie Heights in 2016 shows the three most popular industry sectors were:
- Professional, Scientific and Technical Services (414 people or 12.5%)
- Health Care and Social Assistance (396 people or 12.0%)
- Retail Trade (321 people or 9.7%)
In combination, these three industries employed 1,131 people in total or 34.1% of the total employed resident population.
In comparison, Killarney Heights employed 16.5% in Professional, Scientific and Technical Services; 10.1% in Health Care and Social Assistance; and 8.1% in Retail Trade.
The major differences between the jobs held by the population of Allambie Heights and Killarney Heights were:
- A larger percentage of persons employed in construction (9.2% compared to 6.3%)
- A smaller percentage of persons employed in professional, scientific and technical services (12.5% compared to 16.5%)
- A smaller percentage of persons employed in financial and insurance services (7.1% compared to 9.5%)
- A smaller percentage of persons employed in education and training (8.0% compared to 10.0%)
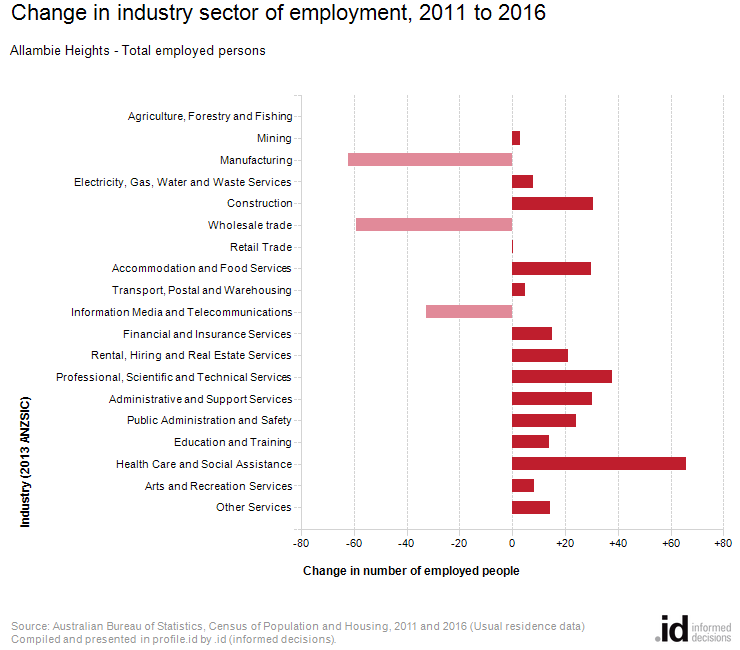
Emerging groups
The number of employed people in Allambie Heights increased by 233 between 2011 and 2016.
The largest changes in the jobs held by the resident population between 2011 and 2016 in Allambie Heights were for those employed in:
- Health Care and Social Assistance (+66 persons)
- Manufacturing (-62 persons)
- Wholesale trade (-59 persons)