Northern Beaches Council area
Non-English speakers - Employment status
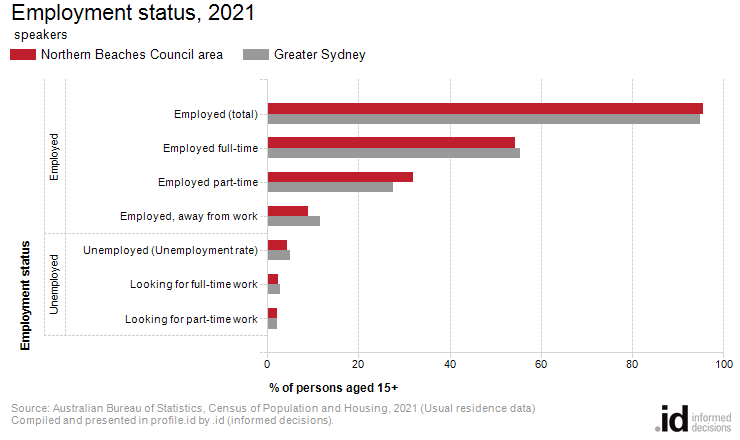
In 2021, 22,015 [Toggles].[COIIDDisplayLabel] speakers who were living in the Northern Beaches Council area were employed, of which 57.0% were working full time and 33.5% part time.
For the non-English speaking population, being able to find work and participate in the local economy is a very important step to settling into Australia. High employment can indicate an engaged migrant community, or perhaps a large contingent on work-sponsored visas. A high level of unemployment or low participation rate (the percentage of the population in the labour force) can indicate a community of recent migrants with difficulties adjusting to economic life in Australia, and perhaps with a reliance on government benefits.
Differences in employment status for the local non-English speaking population may be related to the age and length of time that population has been in Australia, proportion of second-generation migrants, as well as qualification levels.
Please note that due to lockdowns in many parts of Australia and the availability of JobKeeper, users may find that some groups have a significant increase in the ‘Employed, away from work’ category. Use these data with caution when comparing over time to previous Censuses.
Employment data should be looked at in conjunction with Age Structure and Qualification data for the recent arrivals.
Derived from the Census question:
'Last week did the person have a full time or part time job of any kind?'
People using [COIIDLabelForLanguage] at home aged 15 years and over
| Employment status | ||||||||
|---|---|---|---|---|---|---|---|---|
| Northern Beaches Council area - [Toggles].[COIIDDisplayLabel] | 2021 | 2016 | Change | |||||
| Employment status | Number | % | Greater Sydney | Number | % | Greater Sydney | 2016 to 2021 | |
| Employed | 22,015 | 95.5 | 94.9 | 21,022 | 95.1 | 94.0 | +993 | 13000 |
| Employed full-time | 12,542 | 54.4 | 55.5 | 13,026 | 58.9 | 61.2 | -484 | 13001 |
| Employed part-time | 7,378 | 32.0 | 27.7 | 7,089 | 32.1 | 28.2 | +289 | 13002 |
| Employed, away from work | 2,095 | 9.1 | 11.7 | 907 | 4.1 | 4.5 | +1,188 | 13003 |
| Unemployed (Unemployment rate) | 1,032 | 4.5 | 5.1 | 1,086 | 4.9 | 6.0 | -54 | 13004 |
| Looking for full-time work | 545 | 2.4 | 2.9 | 497 | 2.2 | 3.2 | +48 | 13005 |
| Looking for part-time work | 487 | 2.1 | 2.1 | 589 | 2.7 | 2.9 | -102 | 13006 |
| Total Labour Force | 23,047 | 100.0 | 100.0 | 22,108 | 100.0 | 100.0 | +939 | |
Source: Australian Bureau of Statistics, Census of Population and Housing (opens a new window) 2016 and 2021. Compiled and presented by .id (opens a new window)(informed decisions).
| Labour force status | ||||||||
|---|---|---|---|---|---|---|---|---|
| Northern Beaches Council area - [Toggles].[COIIDDisplayLabel] | 2021 | 2016 | Change | |||||
| Labour force status | Number | % | Greater Sydney | Number | % | Greater Sydney | 2016 to 2021 | |
| Total labour force (Participation rate) | 23,047 | 67.6 | 60.0 | 22,108 | 68.9 | 61.6 | +939 | 13500 |
| Not in the labour force | 10,727 | 31.5 | 34.6 | 9,748 | 30.4 | 32.3 | +979 | 13501 |
| Labour force status not stated | 311 | 0.9 | 5.4 | 213 | 0.7 | 6.1 | +98 | 13502 |
| Total persons aged 15+ | 34,085 | 100.0 | 100.0 | 32,069 | 100.0 | 100.0 | +2,016 | 13599 |
Source: Australian Bureau of Statistics, Census of Population and Housing (opens a new window) 2016 and 2021. Compiled and presented by .id (opens a new window)(informed decisions).
Compiled and presented in profile.id by .id (informed decisions).
Compiled and presented in profile.id by .id (informed decisions).
Dominant groups
The size of the Northern Beaches Council area's [Toggles].[COIIDDisplayLabel] speaking labour force in 2021 was 23,047 persons, of which 7,378 were employed part-time and 12,542 were full time workers.
Analysis of the employment status (as a percentage of the labour force) of [Toggles].[COIIDDisplayLabel] speakers in the Northern Beaches Council area in 2021 compared to Greater Sydney shows that there was a higher proportion in employment, and a lower proportion unemployed. Overall, 95.5% of the [Toggles].[COIIDDisplayLabel] speaking labour force was employed, and 2.4% unemployed, compared with 94.9% and 2.9% respectively for Greater Sydney.
Analysis of the [Toggles].[COIIDDisplayLabel] speaking labour force participation rate of the population in the Northern Beaches Council area in 2021 shows that there was a higher proportion in the labour force (67.6%) compared with Greater Sydney (60.0%).
Emerging groups
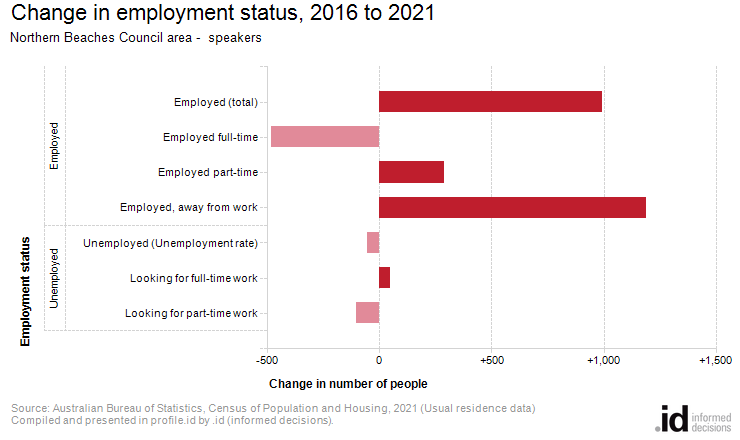
Between 2016 and 2021, the number of [Toggles].[COIIDDisplayLabel] speaking population employed in the Northern Beaches Council area showed an increase of 993 people and the number unemployed showed an increase of 48 people. In the same period, the number of people in the labour force showed an increase of 939 people, or 4.2%.