Mona Vale PCA
Estimated Resident Population (ERP)
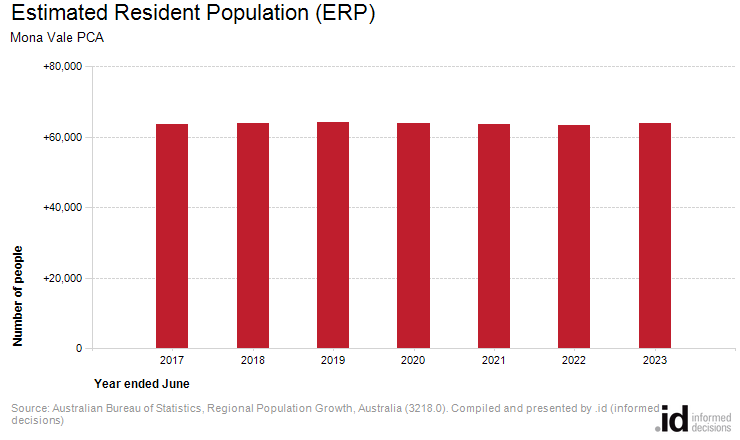
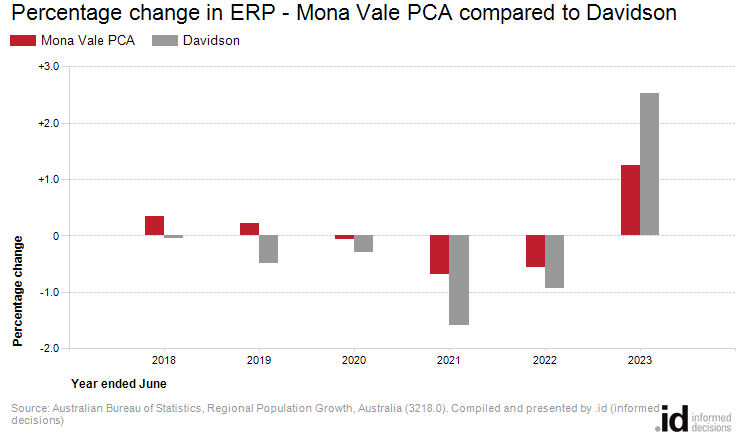
The population estimate for Mona Vale PCA as of the 30th June 2023 is 64,006. Since the previous year, the population has grown by 1.24%. Population growth in Davidson was 2.53%.
The Estimated Resident Population (ERP) is the Australian Bureau of Statistics' official 2023 population figure for all Local Government Areas (LGAs) - but is subject to review after the next Census release. For areas smaller than LGAs, the ERP is derived from SA1 geographies based on population distribution from the previous Census. As such, these smaller geographies are subject to a greater level of revision each Census due to the change in actual numbers and in population distributions.
Populations are counted and estimated in various ways. The most comprehensive population count available in Australia is derived from the Census of Population and Housing conducted by the Australian Bureau of Statistics every five years. However the Census count is generally an under-estimate of the actual population, due to people missed in the Census and people overseas on Census night. To provide a more accurate population figure more frequently, the ABS also produces ERP numbers.
See data notes for a detailed explanation of different population types, how they are calculated and when to use each one.
| Estimated Resident Population (ERP) | |||||||
|---|---|---|---|---|---|---|---|
| Year (ending June 30) | Number | Change in number | Change in percent | Davidson change in percent | |||
| 2017 | 63,707 | -- | -- | -- | 2017 | ||
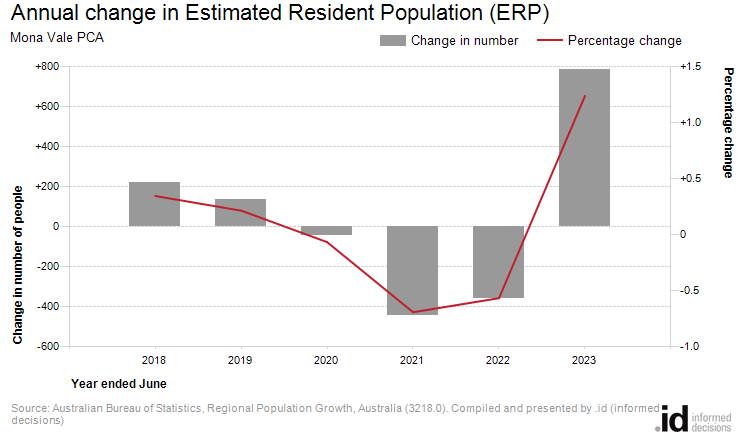
| 2018 | 63,928 | +221 | +0.35 | -0.05 | 2018 | ||
| 2019 | 64,066 | +138 | +0.22 | -0.48 | 2019 | ||
| 2020 | 64,024 | -42 | -0.07 | -0.29 | 2020 | ||
| 2021 | 63,581 | -443 | -0.69 | -1.58 | 2021 | ||
| 2022 | 63,221 | -360 | -0.57 | -0.93 | 2022 | ||
| 2023 | 64,006 | +785 | +1.24 | +2.53 | 2023 | ||
Source: Australian Bureau of Statistics, Regional Population Growth, Australia (3218.0). Compiled and presented in profile.id by .id (opens a new window)(informed decisions).